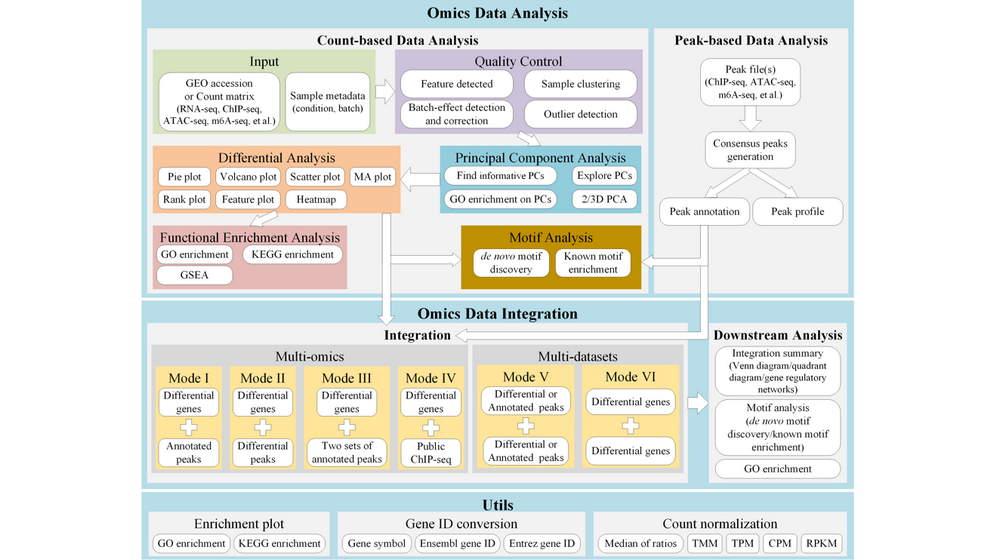
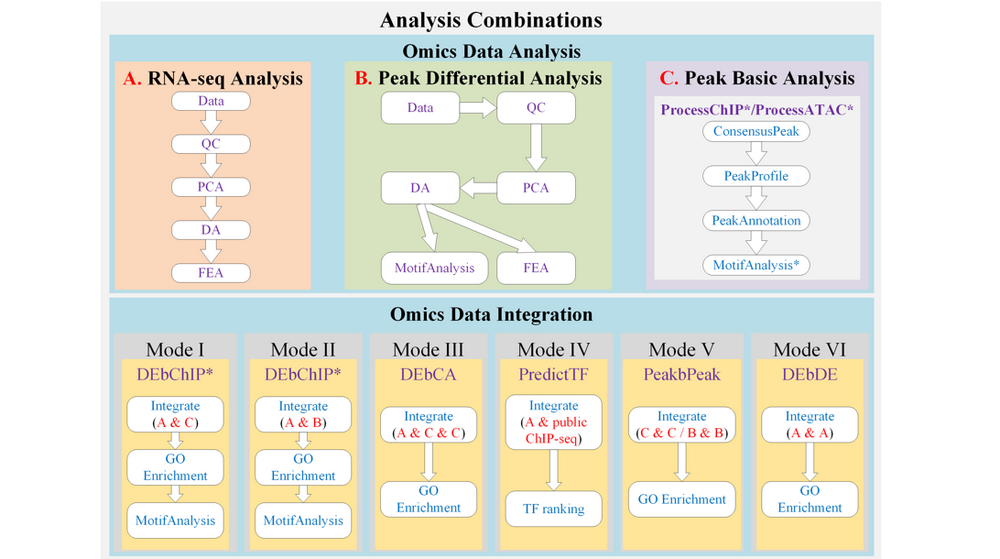

DEbPeak aims to explore, visualize, interpret multi-omics data and unravel the regulation of gene expression by integrating RNA-seq with peak-related data (eg: ChIP-seq, ATAC-seq, m6A-seq et al.) . It contains thirteen functional panels:
-
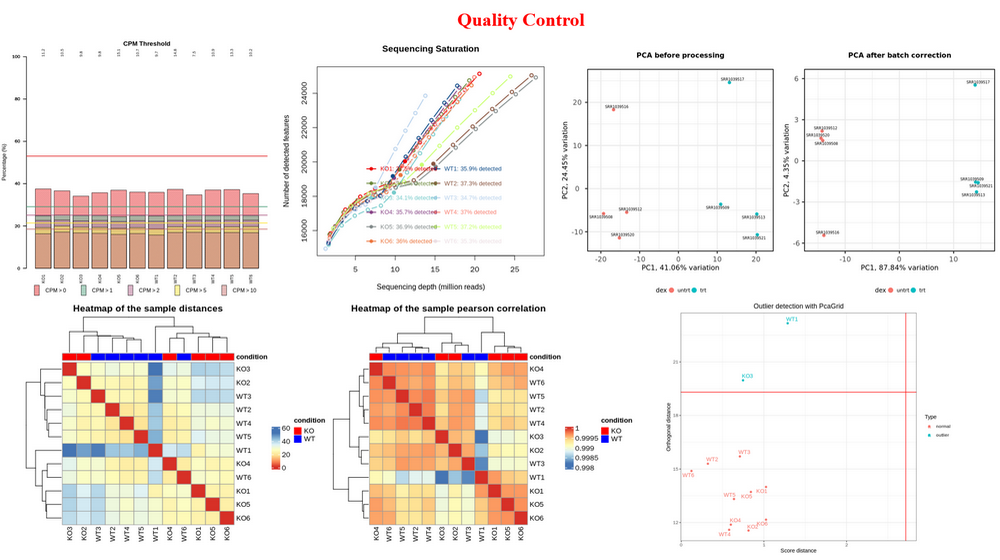
Quality Control (QC) : QC on count matrix (proportion of genes detected in different samples under different CPM thresholds and the saturation of the number of genes detected) and samples (sample clustering based on euclidean distance and pearson correlation coefficient, batch effect detection and correction, outlier detection).
-
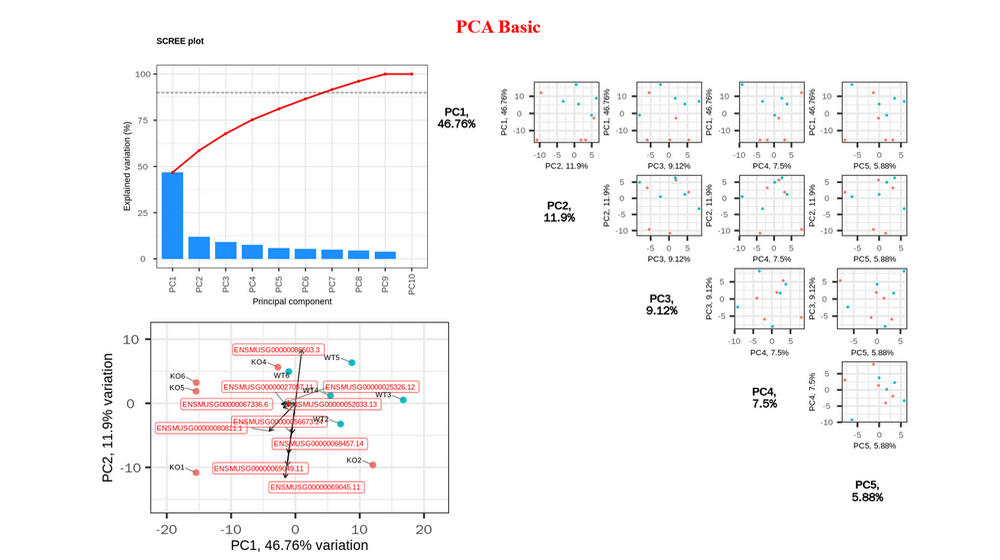
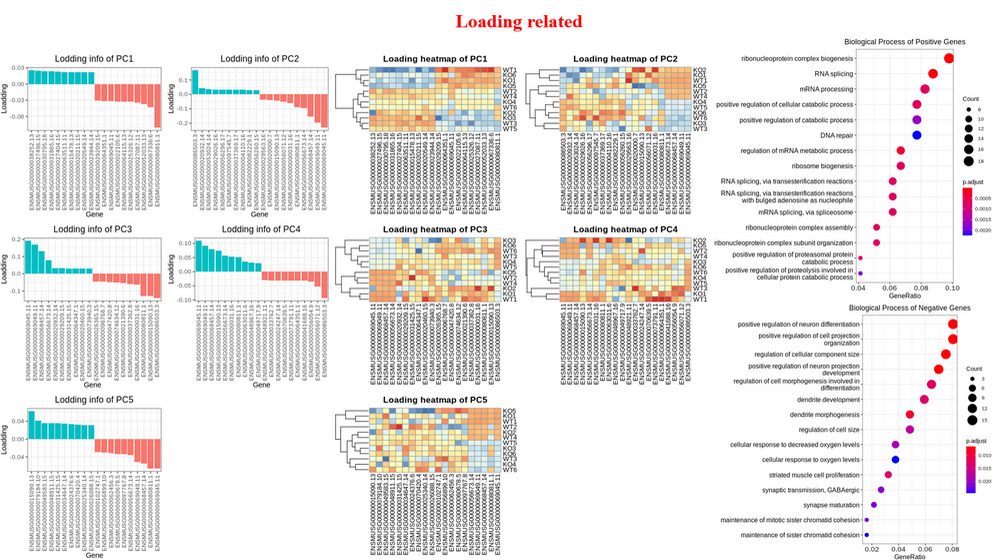
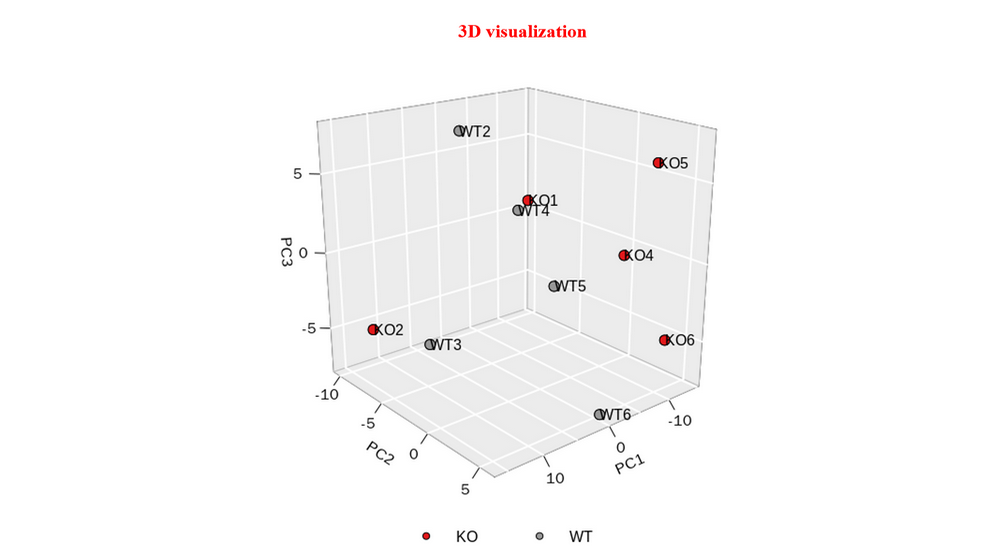
Principal Component Analysis (PCA) : Scree plot and pairs plot to select the useful PCs, biplot to inspect sample similarity with corresponding genes with larger loadings, visualize genes with larger positive and negative loadings on selected PCs (bar plot and heatmap), perform GO enrichment analysis on genes with larger positive and negative loadings on selected PCs, visualize samples with three selected PCs.
-
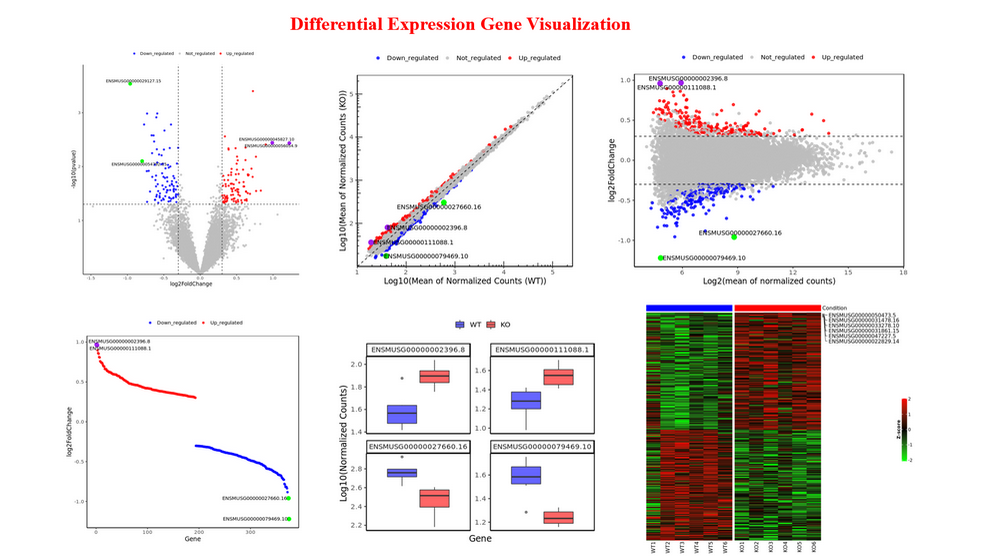
Differential Analysis (DA) : Obtain differentially expressed genes from RNA-seq data, obtain differentially accessible/binding peaks from peak-related data, stat differentially accessible/binding peaks with pie plot and visualize the results interactively or download PDF (VolcanoPlot, ScatterPlot, MAPlot, RankPlot, FeaturePlot, Heatmap)
-
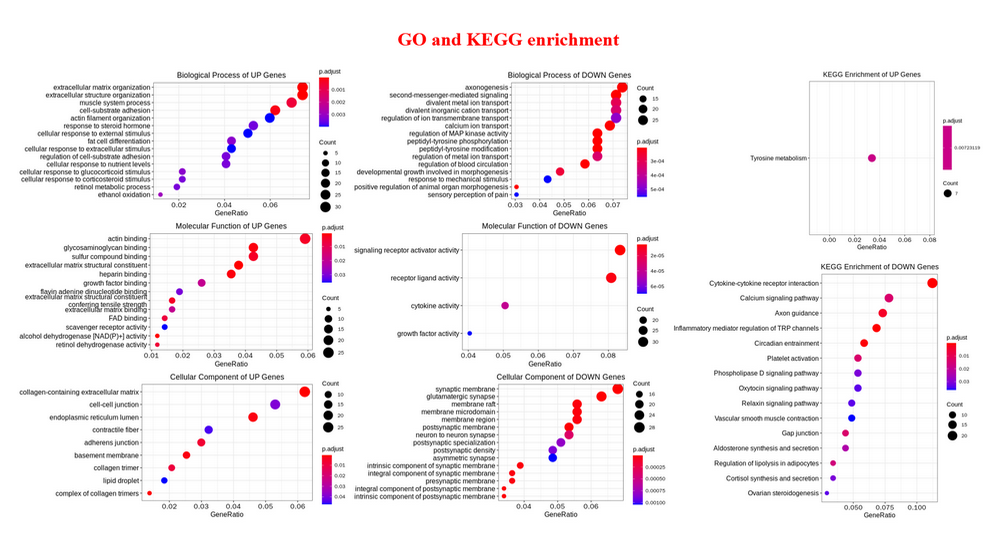
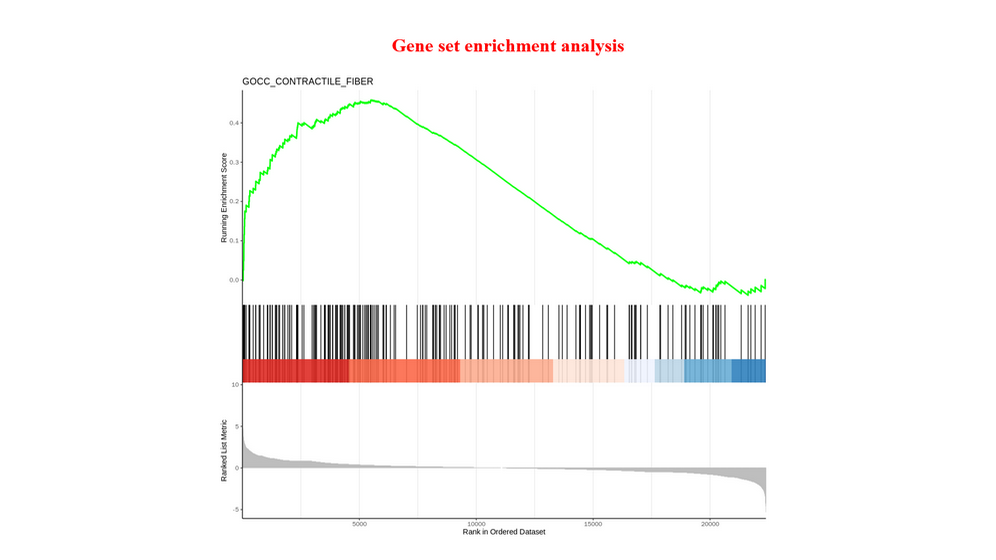
Functional Enrichment Analysis (FEA) : GO enrichment analysis and KEGG enrichment analysis for differentially expressed genes or differentially accessible/binding peaks, Gene Set Enrichment Analysis for all genes of RNA-seq.
-
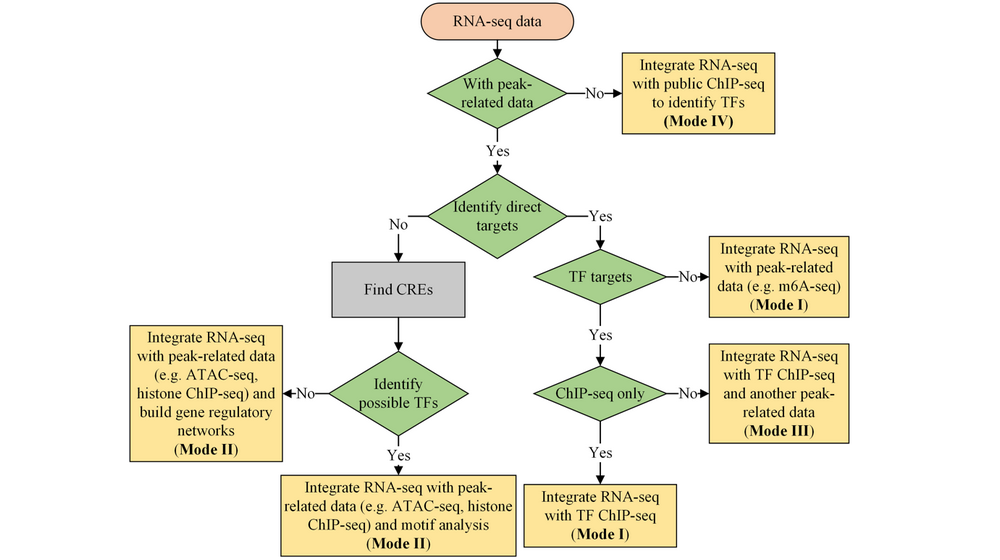
Predict transcription factors (PredictTF) : Identify potential transcription factors with differentially expressed genes.
-
Motif Enrichment (MotifEnrichment) : Motif enrichment on differentially accessible/binding peaks.
-
Preprocess ChIP-seq (PreprocessChIP) : Here, we use ChIP-seq as a reference, you can upload ChIP-seq, ATAC-seq, m6A-seq, et al. This step will Get consensus peaks from replicates, visualize peak accessibility/binding profile, peak annotation (assign peaks with the genomic binding region and nearby genes).
-
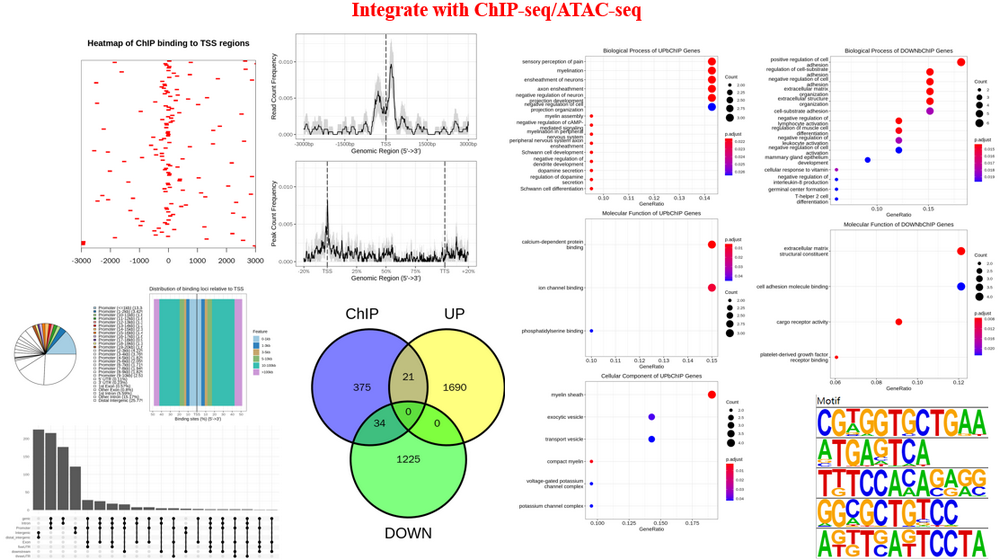
Integrate with ChIP-seq (DEbChIP) : Here, we use ChIP-seq as a reference, you can upload ChIP-seq, ATAC-seq, m6A-seq, et al. This step will Integrate RNA-seq with ChIP-seq based on consensus peaks (consensus mode, based on results of previous PreprocessChIP step) or differentially binding peaks (diff mode, user should upload differential peaks as 'Diff. peak file' obtained from DA step and run DA step to get differential genes or upload differential genes as 'Diff. RNA file' obtained from DA step), integration summary (integration table, venn diagram and quadrant diagram), GO enrichment on integrated results, motif enrichment on integrated results.
-
Preprocess ATAC-seq (PreprocessATAC) : Here, we use ATAC-seq as a reference, you can upload ChIP-seq, ATAC-seq, m6A-seq, et al. This is the second peak-related data used to integrate. Get consensus peaks from replicates, visualize peak accessibility/binding profile, peak annotation (assign peaks with the genomic binding region and nearby genes).
-
Integrate with ChIP-seq and ATAC-seq (DEbCA) : Here, we use ChIP-seq and ATAC-seq as references, you can combine peak-related data as you wish by previous PreprocessChIP and PreprocessATAC. Integrate RNA-seq with ChIP-seq and ATAC-seq based on results of previous PreprocessChIP and PreprocessATAC ( user should run DA step to get differential genes or upload differential genes as 'Diff. RNA file' obtained from DA step), integration summary, GO enrichment on integrated results.
-
Integrate two peak-related data (PeakbPeak) : Integrate two peak-related data based on consensus peaks (consensus mode, based on results of previous PreprocessChIP and PreprocessATAC step) or differentially binding peaks (diff mode, user should upload differential peaks as 'Diff. Peak2 file' obtained from DA step and run DA step to get another set of differential peaks), integration summary (integration table, venn diagram and quadrant diagram), GO enrichment on integrated results.
-
Integrate two RNA-seq data (DEbDE) : Integrate two RNA-seq data, user should upload differential genes as 'Diff. DE2 file' obtained from DA step and run DA step to get another set of differential genes), integration summary (integration table, venn diagram and quadrant diagram), GO enrichment on integrated results.
-
Utils : Useful functions, including creating enrichment plot for selected enrichment terms, gene ID conversion (gene symbol, ENSEMBL gene ID, ENTREZ ID) and count normalization(DESeq2’s median of ratios, TMM, CPM, TPM, RPKM).
This website is free and open to all users and there is no login requirement.
Last updated: 2024/04/01.
Yabing Song: songyb0519@gmail.com.
Empty.
Data Source
Prepare Count Matrix
Count Matrix
Prepare Count Matrix
Prepare Sample Metadata
Sample Metadata
Options
Options (Advanced)
Adjust Plots
Count QC-CPM
Count QC-Saturation
Options
Options (Advanced)
Adjust Plots
Options
3D PCA
Options
Adjust Plots
Options
Options (Advanced)
Visualization
Visualize
Options (Advanced)
Adjust Plots
Options
Options (Advanced)
Adjust Plots
Analyze
Options (Advanced)
Adjust Plots
Upload
Options (Advanced)
Options
Adjust Plots
Options
Analyze
Options (Advanced)
Adjust Plots
Options
Adjust Plots
Options
Adjust Plots
Options
Analyze
Options (Advanced)
Adjust Plots
Options
Adjust Plots
Options
Adjust Plots
Options
Options
Adjust Plots
Options
Adjust Plots
Upload
Options
Adjust Plots
1. How to deal with edgeR results?
DEbPeak is compatible with DESeq2 and edgeR . In this interactive interface, it uses DESeq2 internally, for user with edgeR results, the R package is an ideal choice.
2. How to obtain the R package?
DEbPeak is now available on Github , and is going to Bioconductor .